Meet the Modules: Telemetry
Understanding one of Meshtastic’s most powerful built-in features
Meet the Modules: Telemetry
As mentioned in the first Meet the Modules blog post, modules are a feature included in the Meshtastic firmware allowing users to extend the onboard capabilities of the Meshtastic node. In the last post we looked at how to create a new module, and in this blog (and most likely a few more) we will be looking at already-included modules. One of these modules is Telemetry, a module that creates and sends a “fancy” message filled with data from sensors connected to the Meshtastic node.
Activating the Telemetry Module
Unlike the previous post, the user does not need to modify firmware or change code to activate this module, because it is already enabled by the firmware team (who are, by the way, normal friendly people just like you and me). However, the user does need to change some settings through the mobile app, the web client, or the Python CLI in order to get all telemetry data to be sent.
The standard firmware supports four groupings of telemetry data:
- Device Metrics (of the Meshtastic device)
- Battery Level
- Voltage
- Channel Utilization
- Airtime
- Environment Metrics
- Air Quality Metrics
- Power Measurement Metrics
- Health Metrics
- Heart Rate
- Oxygen Saturation
- Body Temperature
To fully enable telemetry to be sent over radio, the following items need to be considered:
Telemetry Group              Must Be Enabled     Set Update Interval     Can Be Configured From
------------------------------------------------------------------------------------------------
Device Metrics                   No                    Yes              A / B / C
Environment Metrics              Yes                   Yes              A / B / C
Air Quality Metrics              Yes                   Yes              A / B / C
Power Measurement Metrics        Yes                   Yes              A / B / C
Health Metrics                   Yes                   Yes              D

A - Mobile App
B - Web App
C - CLI
D - CLI, but user must compile custom firmware
When using the firmware unmodified, sensors need to be connected to the I²C bus of the Meshtastic node. The reason “unmodified” is mentioned, is that if the user has the capability, the telemetry module can be modified to retrieve data from other interfaces available on the Meshtastic device.
I²C (pronounced “eye-squared-see”) is a very popular and incredibly useful communication method that allows different chips and components inside or connected to an electronic device to talk to each other. Think of it as a simple, high-speed party line for electronics.
The name stands for Inter-Integrated Circuit. It's a standard that was originally created by Philips Semiconductors (now NXP) back in the 1980s.
For a list of supported sensors (and sensor addresses), see the official Meshtastic documentation.
It should be noted that Health telemetry was excluded from the mainline firmware releases due to potential legal risks (for example HIPAA compliance), depending on how it is used. It remains available for users who build custom firmware and understand how they intend to use the data.
Seeing the Data
So now we are collecting and sending data — but how do we see it?
If your Meshtastic node has a display, you can enable telemetry display on the device itself. However, in most cases the sensor-equipped node will be far away or inside a protective case. For this reason the data is sent over the mesh, and other nodes will receive it. The user then has several options for viewing the received telemetry data.
Inside the Meshtastic mobile app, it is possible to click and view the details of the transmitting node, where different logs are available. This displays the data in both graph and list-log formats. The Meshtastic web client also shows telemetry data when selecting the sending node and opening its details.
Note that since Health Metrics are removed from mainline firmware, standard interfaces most likely will not display them (I have not tested this).
The real power of telemetry comes when a node is connected to third-party applications. A frequently mentioned tool in the community is Telemetry Harbor — a comprehensive solution for ingesting, storing, and visualizing telemetry data. They provide a Meshtastic integration script that lets a user connect a Meshtastic device to Telemetry Harbor by running a Python script. While this does not visualize the data directly, it enables the user to create stunning visualizations using something like Grafana, an open-source analytics and dashboarding platform.
Of course, users can also build their own visualization tools in Python.
Using the Data
As I’ve explained previously, it is also possible to connect your Meshtastic listening node to, for example, a Raspberry Pi and connect using the Python Meshtastic module.
    interface = None  # Initialize interface to None outside the try block
    try:
        interface = meshtastic.serial_interface.SerialInterface()
        time.sleep(3)
        myLongName = interface.getLongName()
        local_node = interface.localNode

        pub.subscribe(onReceive, "meshtastic.receive")
        pub.subscribe(onConnection, "meshtastic.connection.established")
        pub.subscribe(onConnectionLost, "meshtastic.connection.lost")

    except Exception as e:
        MeshError = str(e)
It is then possible to check if an incoming packet is telemetry:
def onReceive(packet, interface):
    try:
        match packet['decoded']['portnum']:
            case "TELEMETRY_APP":
                # Parse packet and store in database for later visualization
            case _:
                pass
    except Exception as e:
        logging.warning(f"Error parsing packet: {e}")
The packet can contain the following information, as defined by the telemetry protobufs (and yes, we will need a future blog to explain what protobufs actually are):
DeviceMetrics
- battery_level
- voltage
- channel_utilization
- air_util_tx
- uptime_seconds
PowerMetrics
- ch1_voltage
- ch1_current
- ...
- ch8_voltage
- ch8_current
EnvironmentMetrics
- temperature
- relative_humidity
- barometric_pressure
- gas_resistance
- voltage
- current
- iaq
- distance
- lux
- white_lux
- ir_lux
- uv_lux
- wind_direction
- wind_speed
- weight
- wind_gust
- wind_lull
- radiation
- rainfall_1h
- rainfall_24h
- soil_moisture
- soil_temperature
AirQualityMetrics
- pm10_standard
- pm25_standard
- pm100_standard
- pm10_environmental
- pm25_environmental
- pm100_environmental
- particles_03um
- particles_05um
- particles_10um
- particles_25um
- particles_50um
- particles_100um
- co2
- co2_temperature
- co2_humidity
- form_formaldehyde
- form_humidity
- form_temperature
- pm40_standard
- particles_40um
- pm_temperature
- pm_humidity
- pm_voc_idx
- pm_nox_idx
- particles_tps
HealthMetrics
- heart_bpm
- spO2
- temperature
Extending the Data
As a last note, these data sets can be extended. It should be obvious by now that if you know how to go “under the hood,” you can basically do anything. There is, however, an interesting invitation if you read between the lines:
Supporting Other Sensor Types:
For other interesting sensors and use cases, we need to add a portnum for more generic
telemetry packets, and a second MCU will be required to interact with the sensor and process
the data to be sent over the mesh. This data will not be stored in the nodedb on the device.
If you have a sensor or application that could benefit the Meshtastic community, join the Meshtastic Discord group and start talking about it — “we” might pick it up and start integrating it as a new standard feature. Wink wink… let’s try.
Try This Tonight — Live Temperature & Humidity in Under 15 Minutes
If you’ve read this far, you probably already have at least one Meshtastic device. Here’s the fastest way to get real sensor data working:
1. Buy a AHT20 + BMP280 module sensor (or any similar one) — it’s cheap and works perfectly
→ search AliExpress/Amazon
2. Wire it to almost any common board (example: Heltec Wireless Stick Lite V3):
Sensor VCC → Board 3.3V (on Heltec: pin 2 of header J3)
Sensor GND → Board GND  (on Heltec: pin 3 of J3)
Sensor SDA → Board SDA  (on Heltec: pin 14 GPIO 41 of header J2)
Sensor SCL → Board SCL  (on Heltec: pin 15 GPIO 42 of header J2)
3. In the Meshtastic mobile app:
- Go to Config → Telemetry
- Enable Environment telemetry
- Set update interval to 30 min (or lower via CLI if allowed by duty cycle rules)
4. Reboot the board and wait a few minutes for the first telemetry packet to arrive, then simply tap the sensor node in the app to see:
- Temperature
- Relative Humidity
- Barometric Pressure

AHT20 + BMP280 module
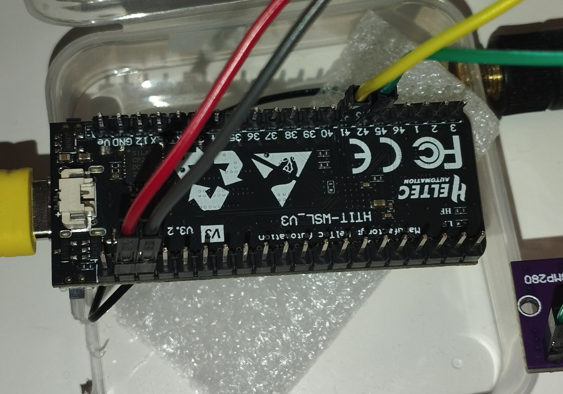
Connection and wiring
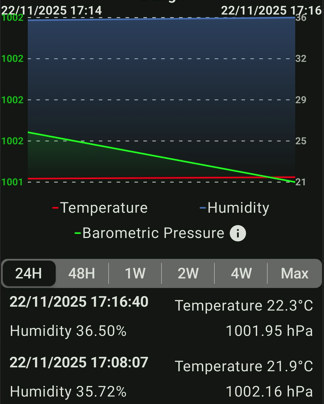
Data graph and log in Meshtastic app

Data graph in Meshtastic app
Conclusion
In summary, I hope I have shown enough to make you curious and start exploring this wonderful module feature in Meshtastic. Who knows — maybe you will start a group of enthusiasts monitoring and improving your city’s air quality, or collaborate with your local amateur weather club to build a sophisticated local weather prediction tool.
I often remind myself that people like Guglielmo Marconi and Nikola Tesla did not innovate because someone told them what to build — they were curious and wanted to solve problems no one had solved yet. You can be that person too. Stay curious.
Written by JohanV
2025-11-24